
At Retarus, transparency is not a marketing claim – it is a core design principle. With the introduction of our new Observability Metrics, we are taking the next logical step, delivering a level of visibility that is currently unique in the market. Effective immediately, customers gain full, unfiltered, real-time access to all security-relevant data generated by Retarus Email Security. No black box. No hidden logic. Nothing to obscure.
This transparency extends beyond security events to include performance metrics such as message processing and delivery times, which are now continuously observable as well.
By exposing what other providers often keep opaque, Retarus enables organizations to maintain a precise, data-driven view of their threat landscape. At the same time, customers have immediate access to reliable metrics required for forensics, audits, and both current and upcoming regulatory and compliance requirements.
Built on Established Standards
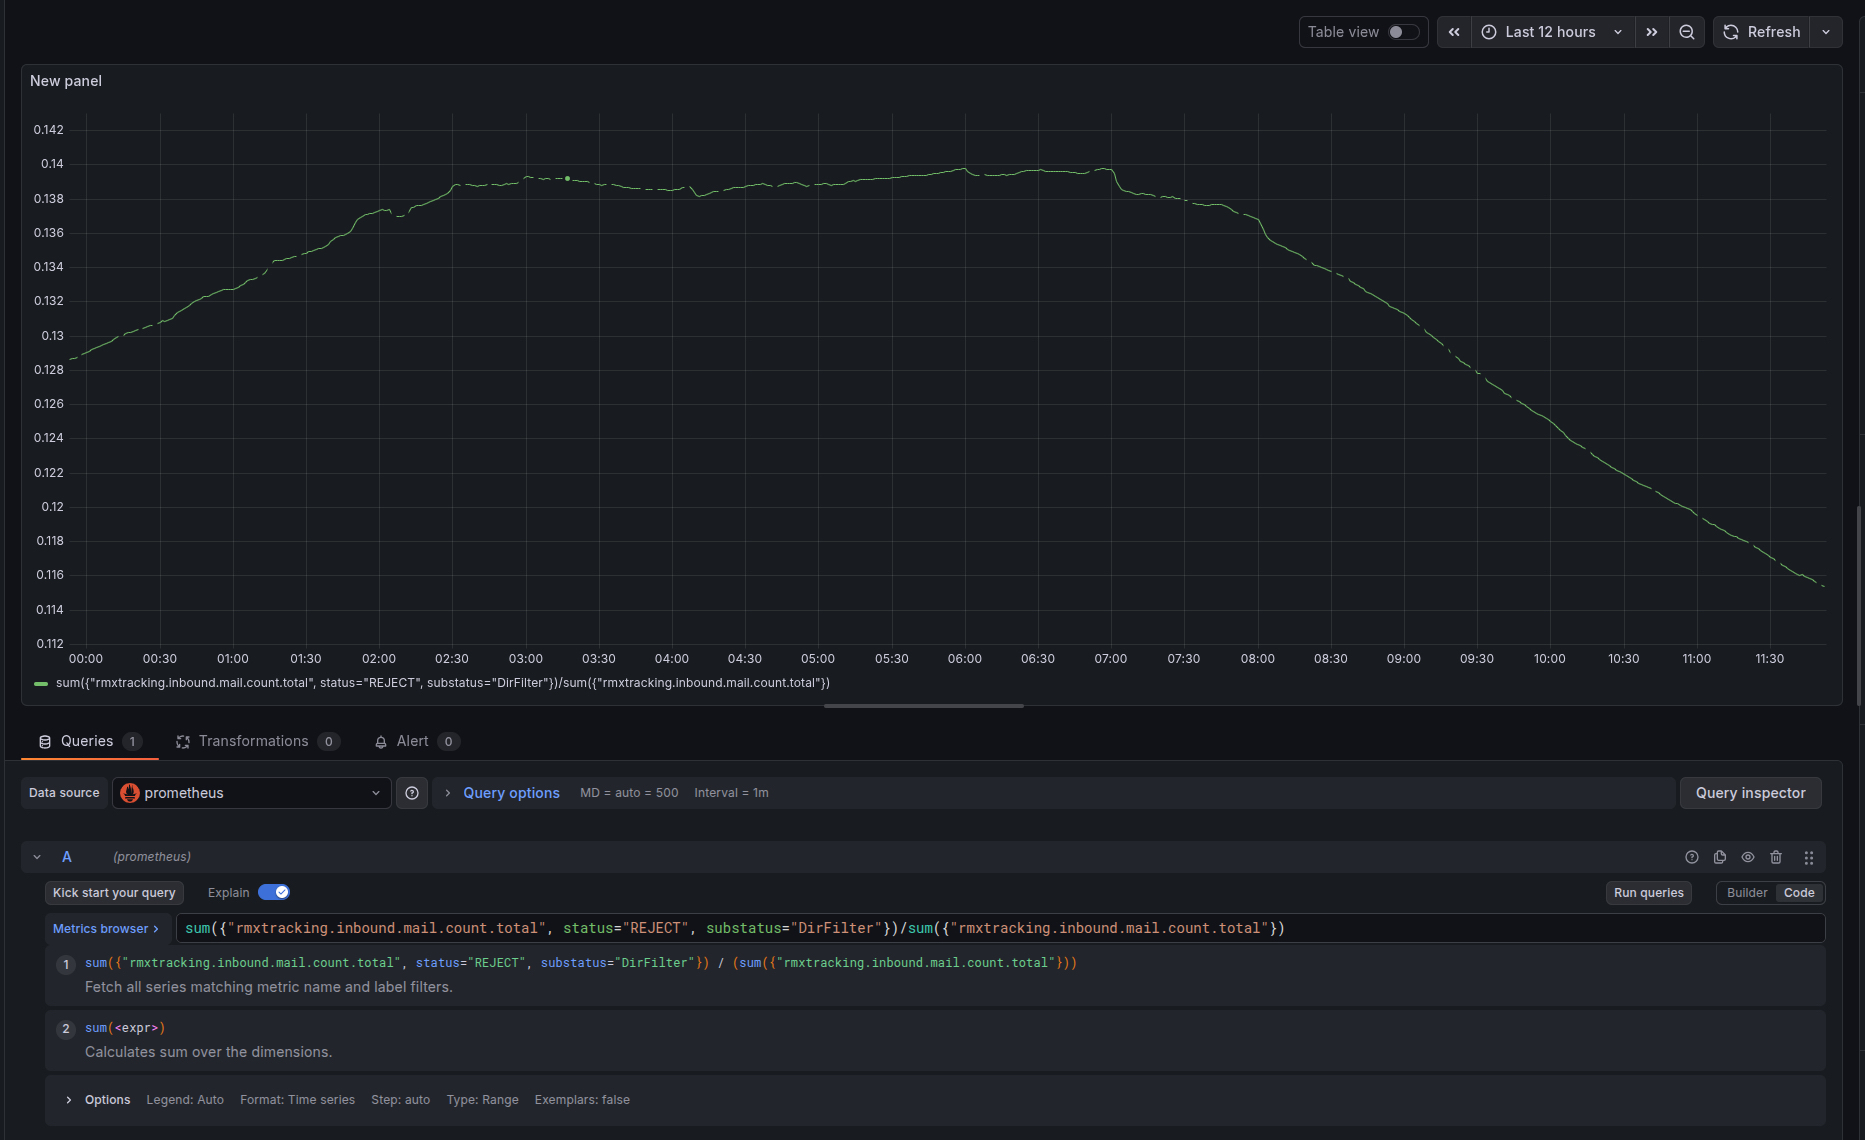
Retarus deliberately relies on established, open standards. All observability metrics are exposed in the industry-standard Prometheus format and can be seamlessly integrated into existing monitoring and observability stacks already in use by our customers, including Grafana, Splunk, Dynatrace, and Elastic.
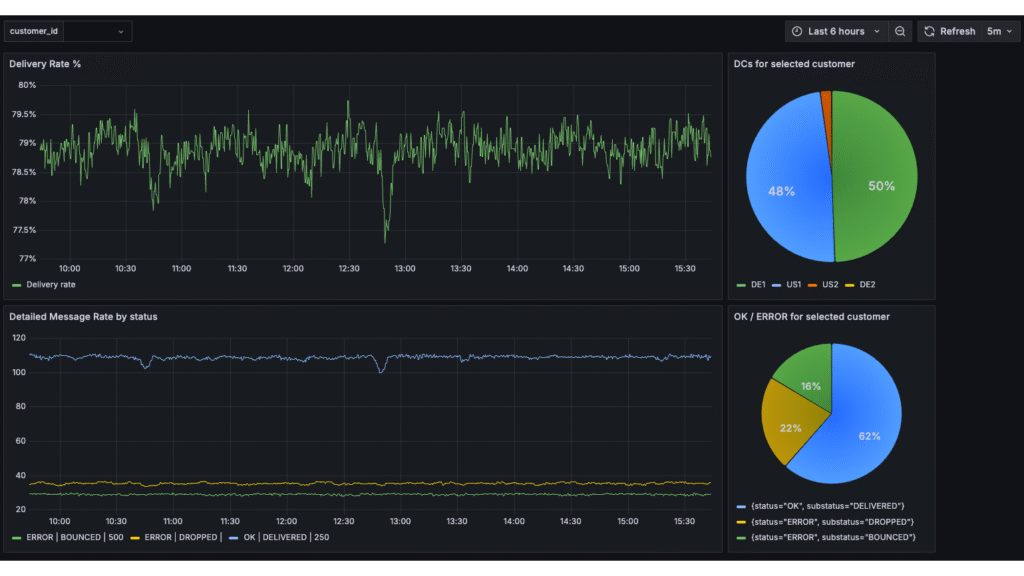
This approach allows organizations to retain full ownership and control of their data while consolidating security and performance metrics in a single, centralized monitoring environment. The resulting dashboards and visualizations provide a unified, correlated view across all email security metrics and become particularly powerful when combined with additional tools, applications, and data sources.
Actionable Insights Instead of Abstract KPIs
The Observability Metrics are designed with operational relevance in mind and provide exactly the information required by security and IT teams in day-to-day operations:
- Directory Filter Monitoring: Visibility into the rate of emails rejected by the directory filter and analysis of their share of total inbound email volume
- Anti-Virus, Spam, and Phishing Detection: Continuous tracking of malware detections, spam filtering, and phishing attempts
- Inbound and Outbound Processing Times: Customer-specific average message processing times across the Retarus infrastructure
- SPF/DKIM Rejections: Clear insight into the number of emails rejected due to missing or invalid sender authentication
- Quarantine Monitoring: Analysis of quarantined emails and their trends over time
- Domain-Level Drill-Down: Detailed insights into affected domains, enabling identification of anomalies, attack patterns, or misconfigurations
Designed for Scalability and Future Requirements
Metrics following the same design principles are already available for other Retarus services, and the dataset is continuously expanded. We work closely with our customers to incorporate real-world requirements and operational use cases into our observability roadmap.
This ensures that Retarus observability metrics remain practical, scalable, and aligned with evolving security, compliance, and regulatory demands.
Interested in a deeper technical overview of which metrics Retarus provides and how they are exposed? Detailed documentation is available in our Documentation Center, or speak directly with our experts.
Because at Retarus, transparency is not optional – and we truly have nothing to hide.


