
We’re expanding our Cloud Fax products with a brand-new set of monitoring dashboards. The Cloud Fax Dashboards visualize inbound and outbound traffic, performance metrics, and error patterns in real time or across selected time periods, giving our customers immediate insight into their organization’s fax traffic. The dashboards are now available in Retarus myEAS, the admin portal for our cloud messaging products.
Visualizing real-time data at a glance
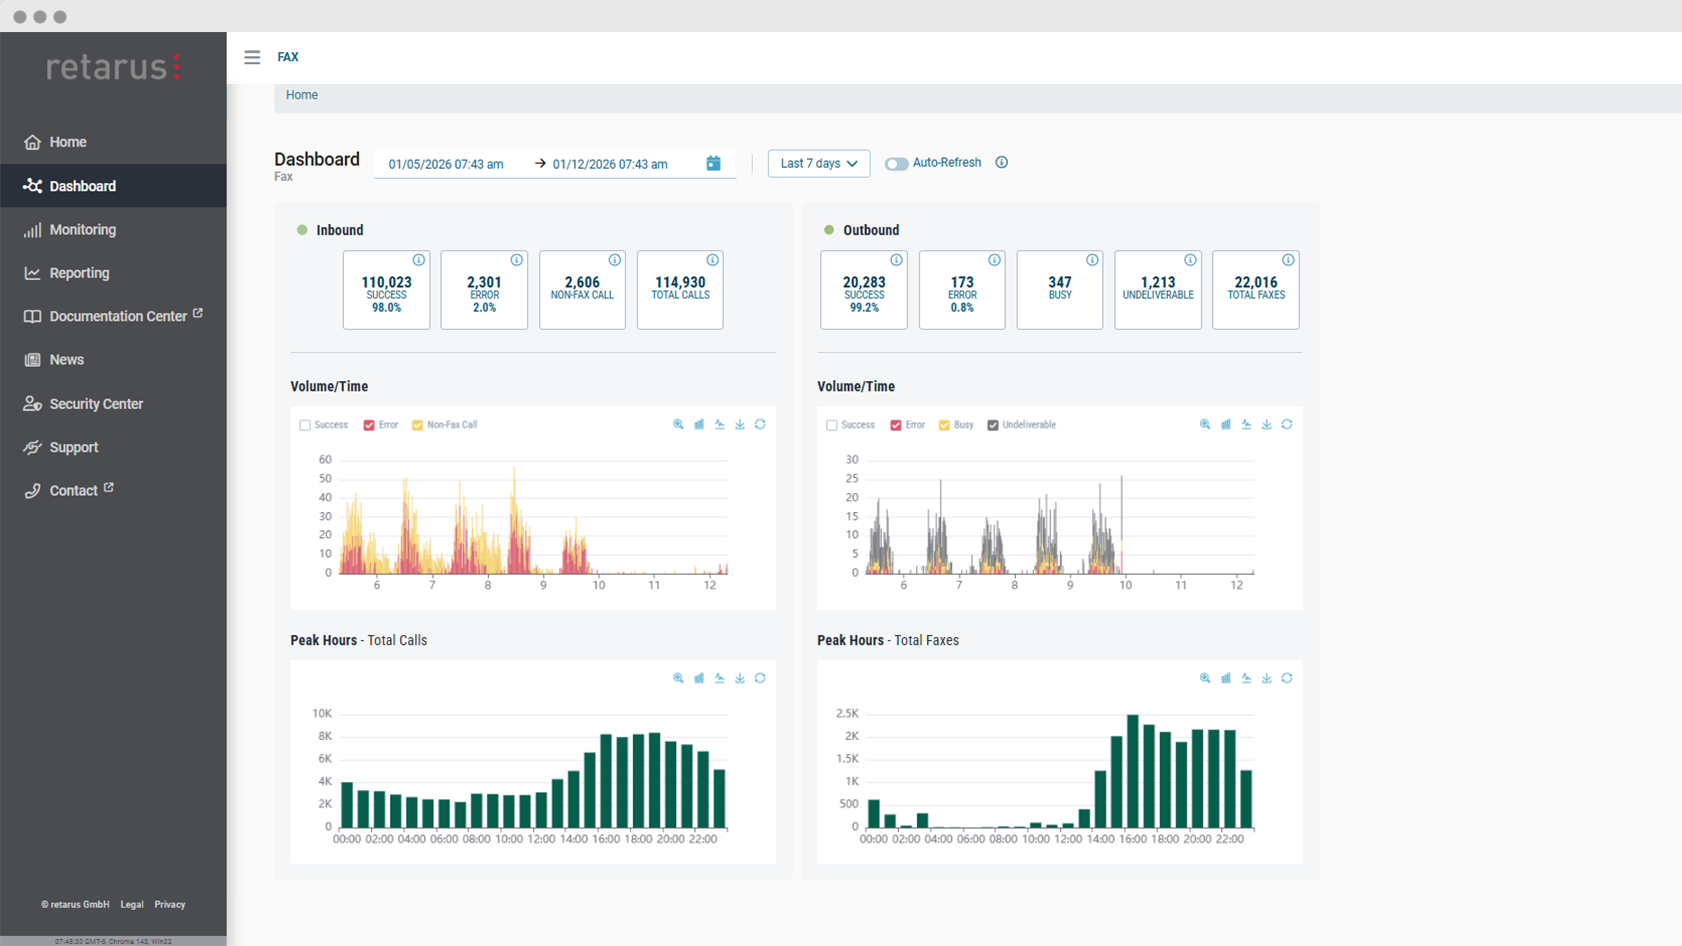
The new dashboards present key data on outbound and inbound fax traffic in a single, clearly structured interface. Instead of relying on static reports, admins can now use interactive charts to visualize live or historical data. This helps IT teams stay informed without digging through the numbers and turn data into actionable insights.
One of the key advantages of the Cloud Fax Dashboards is the real-time visibility into fax communications. By monitoring live visual data, teams can quickly spot issues such as unexpected error spikes or drops in fax volume. Admins can dig deeper into specific error types directly from the dashboards, allowing them to investigate underlying issues in more detail.
Discover patterns and optimize document exchange
Beyond real-time monitoring, admins can use the Cloud Fax Dashboards to get a quick overview of fax traffic for a custom interval in the past, such as a specific day, week, or month. The dashboards provide insights into fax volume and delivery rates, making it easy to identify recurring patterns and trends. Users can quickly see fluctuations in volume, peak load times or changes in success rates over time.
Charts can be customized using filters, and users can switch between bar and line charts depending on their preference or the type of analysis they want to perform.
More transparency, better control
With the introduction of the Cloud Fax Dashboards, organizations gain greater transparency and control over their document exchange. By combining real-time monitoring with historical analysis, the dashboards help turn data into action.


